Shaping Markets
Review: Advertising Tax
05. 29. 2025
A collection of Economic Security for Illinois Action’s work on an Ad Tax for Illinois
Click to add an image!
EXECUTIVE SUMMARY
Recent attempts to create a “digital ad” tax have failed in Maryland, Minnesota, Connecticut, New York, and West Virginia. Core lessons emerged from these attempts:
- The Internet Tax Freedom Act must be respected in that e-commerce cannot be burdened beyond traditional commerce;
- Attempts to tax advertisement firms based on “global” or otherwise out-of-state metrics fail against the dormant commerce clause (depending on the structure of the legislation).
These attempts have provided a framework within which Illinois may pursue an excise tax on advertisements as a whole. Data suggests a progressive revenue structure that scales with the size of the advertisement firm, from 1% to 10%, could generate between $605 million and $838 million annually. This tax would be structured to capture spending from large advertising and media corporations that dominate the landscape, while exempting nonprofits organizations, nonprofit news outlets, and political campaign advertising. The highest effective tax rates will be on media buying agencies and outdoor advertising firms where corporate consolidation is highest, with just eight firms handling 84% of the reported media buying receipts and 17 outdoor advertising firms handling 77% of the industry’s activity. The vast majority of the impacts of the tax will fall on companies with more than 500 employees.
The following memo reviews the advertising industry, recent experience, revenue analysis, and census data to determine potential revenue generation and impact.
DETAILED ANALYSIS
Legal Protections Against ITFA & Interstate Commerce Clause Challenges
A tax on all ads can be structured in compliance with the Internet Tax Freedom Act (ITFA) by ensuring equal treatment across advertising formats—digital, print, broadcast, and physical advertising, etc. —without imposing discriminatory tax burdens on online platforms.
Additionally, the tax can be structured to comply with the Commerce Clause by applying economic nexus principles and market-based sourcing, similar to Illinois’ existing sales and use tax laws. This means the tax would only impact companies reaching a certain threshold of advertising revenue generated in or targeted in Illinois, ensuring out-of-state business activity is not disproportionately burdened. A clear connection between taxable activity and Illinois consumers is critical.
Exemptions for Government Entities & Nonprofits
- Nonprofit organizations, charities and public service entities should not incur additional tax burdens.
- Government entities, including federal, state, and local governments, ensure public-sector advertising is not taxed.
- Public health, safety, and welfare advertising, safeguarding government sponsored campaigns from taxation while maintaining content-neutrality to prevent First Amendment challenges.
- A high-receipting threshold may be established for income to be considered taxable, creating space for local news organizations to compete and build a presence without being impacted by this tax.
Finally, the progressively structured tax rate could capture advertising firms that span the entirety of Illinois’ advertising ecosystem. This structure is necessary to avoid claims of undue burdens on digital platforms, avoiding a common legal argument that the tax would functionally only impact digital firms and therefore violate ITFA and/or the Dormant Commerce Clause. It is of primary importance to tax all advertising in Illinois at an equitable scale to directly formulate a policy that informs a more equitable advertising industry. A progressive structure also creates space for small businesses to thrive, ensures that all industries contribute significantly to the state’s economic landscape, and contributes fairly to the public good.
MARKET ANALYSIS: GLOBAL AND NATIONAL TRENDS
Global ad spending reached an estimated $1.07 trillion in 2024, according to WARC. This represents a doubling of global ad investment over the past decade. A significant portion of this growth has been driven by just three companies—Google, Meta, and Amazon—which together account for 70% of the incremental ad spending globally and are projected to capture 43.6% of all ad spend this year. In the U.S. digital advertising market alone, Google holds 28%, Meta 23%, and Amazon 14%, meaning the three tech giants collectively control more than 65% of all U.S. digital ad spending.
Online advertising is now the dominant force in the U.S. market. After explosive growth in 2021 (35.4%), the pace slowed somewhat in 2022 (10.8%) and 2023 (7.3%), but projections show a rebound with 12.4% growth expected in 2025, reaching $252.8 billion. Online ad spending is expected to climb to $357.5 billion by 2028, making up the majority of U.S. ad investment. Within this digital landscape, retail media—ads placed on e-commerce platforms like Amazon—represent nearly 18% of all internet advertising, underscoring the shift in consumer attention and ad strategy to digital platforms.
Traditional advertising channels, in contrast, are experiencing a steady decline. Television advertising, which peaked at $65.4 billion in 2018, has been declining since the pandemic and is projected to drop to $48.4 billion by 2028, with an average annual decrease of -2.58%. Radio advertising follows a similar trend: after a high of $18.2 billion in 2019, spending fell to $15.7 billion in 2023, down from $16.2 billion in 2022.
Out-of-home (OOH) advertising, including billboards and transit displays, has rebounded since the pandemic. In 2023, OOH reached $10.5 billion, with a projected rise to $12 billion by 2028. Notably, OOH surpassed newspaper advertising for the first time last year. Meanwhile, newspapers, combining both print and digital ad sales, generated $10.55 billion in revenue, projected to decline to $9.8 billion by 2028. Magazine advertising, too, continues to contract—reaching $8.12 billion last year with a rapid decline of -4.66% annually. While consumer magazines are estimated at $7.57 billion, trade magazines, though growing slightly, remain small at $2.3 billion.
Emerging media segments such as podcast, music streaming, and video game advertising remain relatively small but are growing steadily. Podcast advertising brought in $2.34 billion last year and is expected to grow to $3 billion by 2028. Digital music streaming ads totaled $2.27 billion, with a projected rise to $2.526 billion. In-game video advertising was $1.656 billion last year, climbing modestly to $1.785 billion by 2028. Cinema advertising, while the smallest tracked category, is expected to reach $1.004 billion by 2028.
MARKET ANALYSIS: ILLINOIS’ EXPERIENCE
North American Industry Classification System data (NAICS), a metric used by the Census, suggests that at least 11 types of businesses sell advertisements in Illinois, totalling about $16.45 billion in gross receipts as of 2022. Of those, about 20% are represented by television, radio, direct mail, and out-of-home (or “outdoor”) advertising. About 27% of all receipts are from dedicated internet or web search portals. As reported by the census, the remaining 53% of all advertising is directed through advertising agencies, public relations agencies, or distribution services, all of which include a mix of online and physical advertisements.
NAICS data showed that 2,033 firms operated in Illinois in the advertising industry in 2022. These firms employed about 47,500 people and had an annual payroll of $5.1 billion and total gross receipts of $16.45 billion. However, not all industry receipts may be subject to the proposed advertising tax. Distributors and public relations agencies may generate a larger share of receipts from contractual services or consulting than from selling advertisements specifically. Economic Security for Illinois Action (ESILA) excluded these receipts from the final total revenue count to conservatively estimate the impact of this ad tax proposal. Some variations of the Ad Tax discussed below could be structured to include those receipts, however.
NAICS data further stratifies each industry by size, as determined by the number of employees hired. ESILA may provide a full breakdown of each industry by size, including average receipts, effective tax rates, and total tax revenue. In summary, about 71% of all gross receipts are represented by ad-based industries with over 500 employees. Just 3% employ five or fewer employees, 5.6% employ between 6 and 20 employees, and 20.4% employ between 21 and 500 employees. Total tax revenue generated follows a similar structure: 71% of all revenue is generated from the largest ad firms, representing just 6.5% of all firms in Illinois. The advertising industry is therefore top-heavy, with many small firms carrying a small fraction of all activity.
A PROGRESSIVE TAX ON ADVERTISEMENTS: POLICY ANALYSIS
Below is a chart showing each sector of the ad industry’s impact on total tax revenue generated. Internet publishing and broadcasting account for about 29% of all revenue generated, with an effective tax rate of 6.41%. Advertising agencies account for another 27%, and “traditional” (TV, radio, physical outdoors, and mail ads) media account for about 20% of total revenue collected.
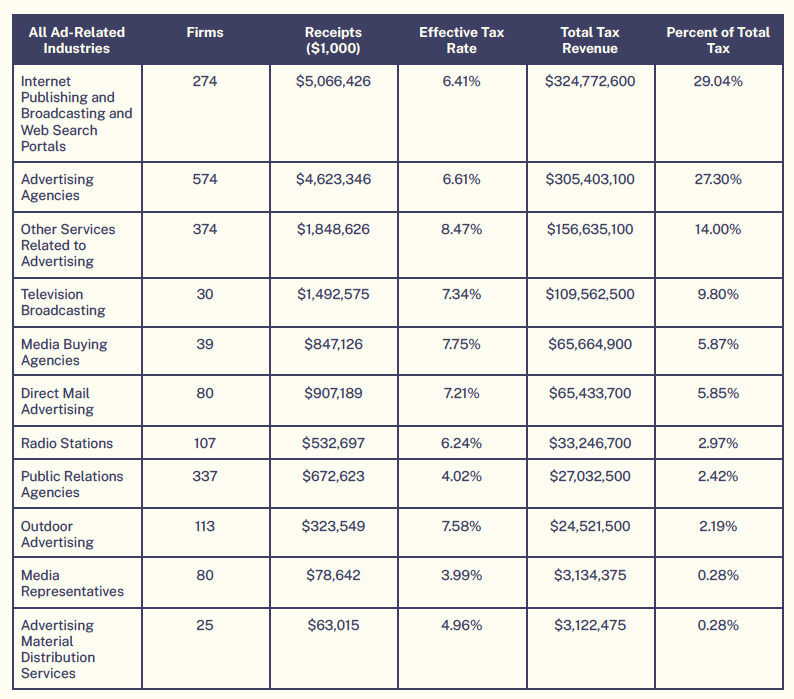
The highest effective tax rates are on Media Buying Agencies and Outdoor Advertising, which tends towards a smaller pool of much larger firms handling the majority of activity. For Media Buying Agencies, just eight firms handle 84% of the reported receipts. 17 Outdoor Advertising firms handle 77% of the industry’s activity.
Advertising agencies represent all market activity generated by media planning companies that buy ad space, consult, and create digital marketing. Internet publishing and broadcasting encompasses businesses that solely sell digital advertising space, online subscriptions, and data licensing, including advertisement activity on search engines, social media, and other content monetization transactions. See Appendix A for a complete list of the definitions for each industry type as described by the NAICS.
A PROGRESSIVE TAX ON ADVERTISEMENTS: REVENUE ANALYSIS
ESILA reviewed eleven NAICS “advertising”-coded industries, which represent a total $16.45 billion market as of 2022. This matched national data from 2019 that showed Illinois representing about 4.57% of the US market: about $16 billion of the $349 billion industry in 2019.
To calculate total revenue, we employed a progressive revenue tax formula against the gross receipts minus payroll receipts to identify net receipts. The formula calculates the tax progressively by dividing net receipts into different tax brackets, applying the appropriate rate to each portion. This calculation, assuming 100% compliance from all receipts and industries, generates over $1.1 billion gross revenue.
NAICS data is not deep enough to separate receipts that result from disparate activities like advertisements vs. contractual services or subscriptions. Upon review of each section, Public Relations Agencies, Advertising Material Distribution Services, and Other Services Related to Advertising may encompass too much market activity unrelated to transactions specific to buying or selling advertisements. In order to produce a conservative, defensible estimate, we subtracted a total $186.8 million revenue generated from these industries against the total gross revenue above to calculate the total net revenue described on the first page.
Finally, it is important to acknowledge that achieving 100% compliance with a new tax is unlikely. Compliance can range, especially as they launch and market actors adjust practices, from as low as 65% to upwards of 90%. Our final revenue calculation considers this range (65%-90% compliance), and we estimate that total net revenue generated from this advertisement tax could be between $605 million and $838 million annually.
ADVERTISEMENTS & THE SALES TAX: REVENUE ANALYSIS
This addendum explores how the Sales Tax distributes revenue and how advertising services may operate within the current structure. The rate structure for the sales tax is as follows: a total 6.25% tax for all receipts over $2.5 million (targeting about 18% of the advertising industry). 80% (5% tax rate) of total revenue remains with the State, and 20% (1.25%) is distributed to local governments mirroring current sales tax remittances. The “local share” of the sales tax is distributed as follows:
- 16% (1.0% rate) goes to municipalities:
- This is distributed based on where the sale originated (if it’s an in-store purchase) or where the item was delivered (for online sales).
- If the sale happens in an unincorporated area, the county receives this portion.
- 4% (0.25% rate) goes to counties and mass transit districts
- Counties receive this based on the same origin-based or destination-based rules.
- Some of this funding supports mass transit districts, like the Regional Transportation Authority (RTA) in the Chicago area.
Local governments can impose additional sales taxes, which vary by city and county. If advertisements are built into the sales tax, these rates would apply. This option removes past restrictions on services-based NAICS industries by expanding the sales tax to cover all ads and related services, unlike the excise tax, which applied only to ad sales. The chart below highlights revenue to the State, Cities, and Counties. This does not include additional revenue from higher individual rates localities and transit districts may have enacted. Numbers in $1,000s. A deeper breakdown of impact can be provided upon request.

APPENDIX A: Definitions of NAICS Categories
Advertising Agencies NAICS.com – 541810
- Establishments that create advertising campaigns and place ads across various media, including print, digital, radio, and television.
- Includes creative development, media planning, strategy consulting, and ad production.
Public Relations Agencies NAICS.com – 541820
- Companies that manage communication strategies to promote businesses, individuals, and organizations.
- Includes press release distribution, crisis management, lobbying, and branding services.
Media Buying Agencies NAICS.com – 541830
- Agencies that purchase advertising space and resell it to businesses or ad firms.
- Services include: programmatic ad buying; TV/radio placements; digital media purchases.
Media Representatives NAICS.com – 541840
- Independent firms or individuals who sell advertising space on behalf of media companies.
- Involves negotiating ad placements for newspapers, magazines, TV, and radio.
Outdoor Advertising NAICS.com – 541850
- Businesses engaged in selling ad space on billboards, transit vehicles, and public locations.
- Includes digital billboards, event sponsorships, and street furniture advertising.
Direct Mail Advertising NAICS.com – 541860
- Companies that design, print, and distribute promotional materials via mail or delivery.
- Includes flyers, coupon books, catalogs, and personalized mailing campaigns.
Advertising Material Distribution Services NAICS.com – 541870
- Establishments that physically distribute advertising materials through various channels.
- Methods include door-to-door flyer distribution, event marketing, and sample giveaways.
Other Services Related to Advertising NAICS.com – 541890
- Miscellaneous advertising-related businesses not classified under other categories.
- Includes sign painting, promotional merchandise distribution, and ad installation services.
Internet Publishing and Broadcasting and Web Search Portals NAICS.com – 519130
- Businesses that publish, broadcast, or provide content exclusively on the internet.
- Includes search engines, streaming platforms, online news sites, and digital media.
Television Broadcasting NAICS.com – 515120
- Companies that broadcast TV content to the public, including networks and local stations.
- Involves news programming, syndicated shows, and live event coverage.
Radio Stations NAICS.com – 515112
- Establishments that broadcast audio programs via radio frequencies or online streaming.
- Includes music stations, talk radio, sports broadcasting, and satellite radio services.